Automata Model of Voting Influences
Background
Social media provides a platform to which group of friends can share information. The power of influence is a function of how close individuals are within a network and how many individuals have shared the information. Social media presents the opportunity to study how dissemination influences voting patterns within a network of friends.
Objective
To explore the extent to which information shared within a network affects voting patterns of a population.
Application
Using an node adjacency matrix to map a network of friends and observing how the spread of information affects voting trends amongst the population. Information flow will be dependent on probabilities of "sharing" and seeing a message.
Results analyzed will be compared to a base rate probability of voting, where social media influence is not a factor. The comparison between the simulation result and this statistic will present the extent of social media influences on voting behavior for one network of friends
Probabilities and Automata Model
We based our simulation off a past experiment done via Facebook that demonstrated how messages directly influenced political self-expression, information seeking and real-world voting behavior of millions of people.
We differentiated between the types of political messages and social media followers to vary the results:
There are 2 types of political messages:
Informational message: initially gets a political ad on their social media timeline
Social message: sees a post indicating that their friend has voted
There are 2 types of friends
Distant friends: they all have an equal chance of seeing a post
Close friends: they are twice as likely to see the post
Statistics:
Here are the statistics we used to define our probabilities and automata models:
About 61.4% of eligible voters voted in 2016 US election (US Census Bureau). Goal is to find how many people would likely vote based on our mode, compared to baseline 61.4% of eligible voters.
A person who receives the informational message is 0% more likely to vote while a person who receives the social message is 0.39% more likely to vote (from the past Facebook experiment).
About 22% of registered voters post about voting on their social media platform (Pew Research Center).
Social Network Node Adjacency Matrix
We imported a node adjacency matrix describing a group of 4038 friends on Facebook with varying numbers of connections. Then based on our research there is some diffusion of the political posts, and informational ads within the matrix, which would result in some increase in voting, which we simulated.

Analyzing a Transition Matrix with Known Voter Probabilities
1. In order to simulate our project, we normalized the node adjacency matrix to reflect the probability of someone seeing their friends’ post
We first assumed that everyone posts once a day, and that the probability of someone seeing a friend’s post is equal to 1 divided by their number of friends
We then adjusted this to assume that a close friend is twice as likely to see someone’s post than a distant friend.
We defined close friends as people who have 4 or more mutual friends. So for example, if you have 2 friends, and 1 of them is a close friend, you have have a ⅔ chance of seeing the close friend’s post, and a ⅓ chance of seeing the distant friend’s post
2. Next, using the random permutation function in MATLAB, we randomly selected 10% of the people in the experiment to receive an informational political ad about voting
Based on the research that we mentioned earlier, we assumed that each of these people have a 22% chance of reposting about the political ad.
To simulate this, we used the binomial random function in Matlab to determine whether or not each person reposts.
3. If they do post about it, the probability of any given friend seeing the ad is based on the normalized transition matrix probabilities that we generated in the first step. This was again simulated using the binomial random function, to determine whether or not each friend sees the post.
After 1 time step, we looked at who saw the post based on the simulation and updated our data using our researched statistics:
Someone’s individual probability of voting increases by 0.39% for each friend’s post that they see.
Someone who sees the post now has a 22% chance themselves of reposting about it in the next time step
And then, we were able to repeat this simulation for a desired number of time steps.
Implementation using MATLAB
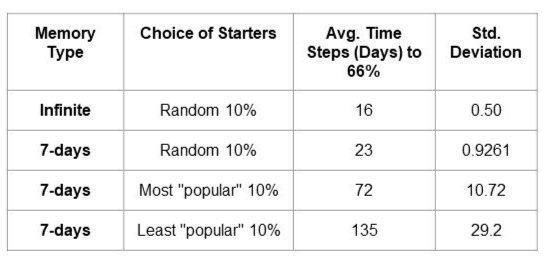
Based on the simulation, we ran 5 experiments, each 100 times, where we varied different parameters with the goal of seeing how many time steps (days) it would take for the message to be seen by 66% of people
One parameter we varied was memory type, which corresponds to amount of time the person has to decide to repost the message once they've seen it
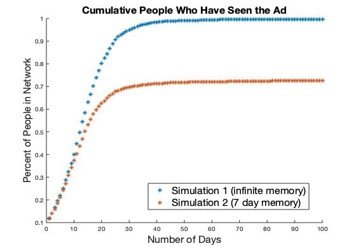
First we assumed that if someone saw the message on their feed, every time step after that, they got to decide whether or not to share it, (with a 22% probability of deciding to repost). Even if they saw it on day 1, on days 2-100 they decide whether to reshare. We ran this simulation 100 times, and got an average of 16 steps very reliably.
Then we made a more realistic simulation, assuming that if a person doesn't repost it after 7 days they forget about seeing the message and have to wait until it is shared again by a friend to their feed to have a chance of reposting. Within the more realistic simulation, we varied another parameter: choice of which 10% distributed the original message to either random 10% of people, or purposefully chose a certain group.
We assumed that when the top 10% most connected started with the message it would spread quicker but the opposite was true, likely because they mostly shared among each other and not those on the periphery who were less connected to them
We also started with distributing the message to the 10% with the least amount of friends in the network. As predicted it took a long time for 66% to receive the message but you can see that the results were highly variable based on standard deviation. Occasionally the message would spread really rapidly because it would reach a well-connected person by chance. The results of the random simulations were very reliable because it picked people from all points in the network!
So overall, social media networks like Instagram and Facebook should choose randomly from networks of friends when deciding who to target with political ads if they want it to diffuse more quickly.
Results
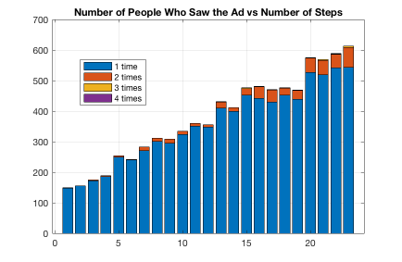
Looking at the results of our 7 day memory random choice of starters simulation:
We found that the political post was diffused within about 66% of our population within 23 steps from first posting it. The graph below shows that although most of the friends saw the post once, some of them saw it up to 4 times. The likelihood of a friend reposting is the same, irrespective of how many times they see the post.
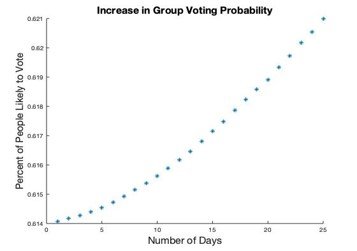
We established that the percent of people who voted based on social media influence is 61.97% vs the baseline of 61.4%. For infinite memory, we notice a greater increase of 62.48%. The calculated increase in voting turnout was around 0.57%. To put things in perspective, in terms of the population of the US in 2020, that is about 1.88 M people.
It has been found that to incentivize their friends to vote, a person needs to post within a 23-day period before election day.
All in all, social media influence on voter turnout is significant, especially when extending our model to a bigger population, when a 0.57% increase is about 2M people that may sway the election results.
Feel free to check out our MATLAB code, presentation slides, and everything else on my Github.